
Date: March 23, 2026 Subject: The 48-Hour Ultimatum Status: High-Frequency Stagnation
The Signal (The Hive)
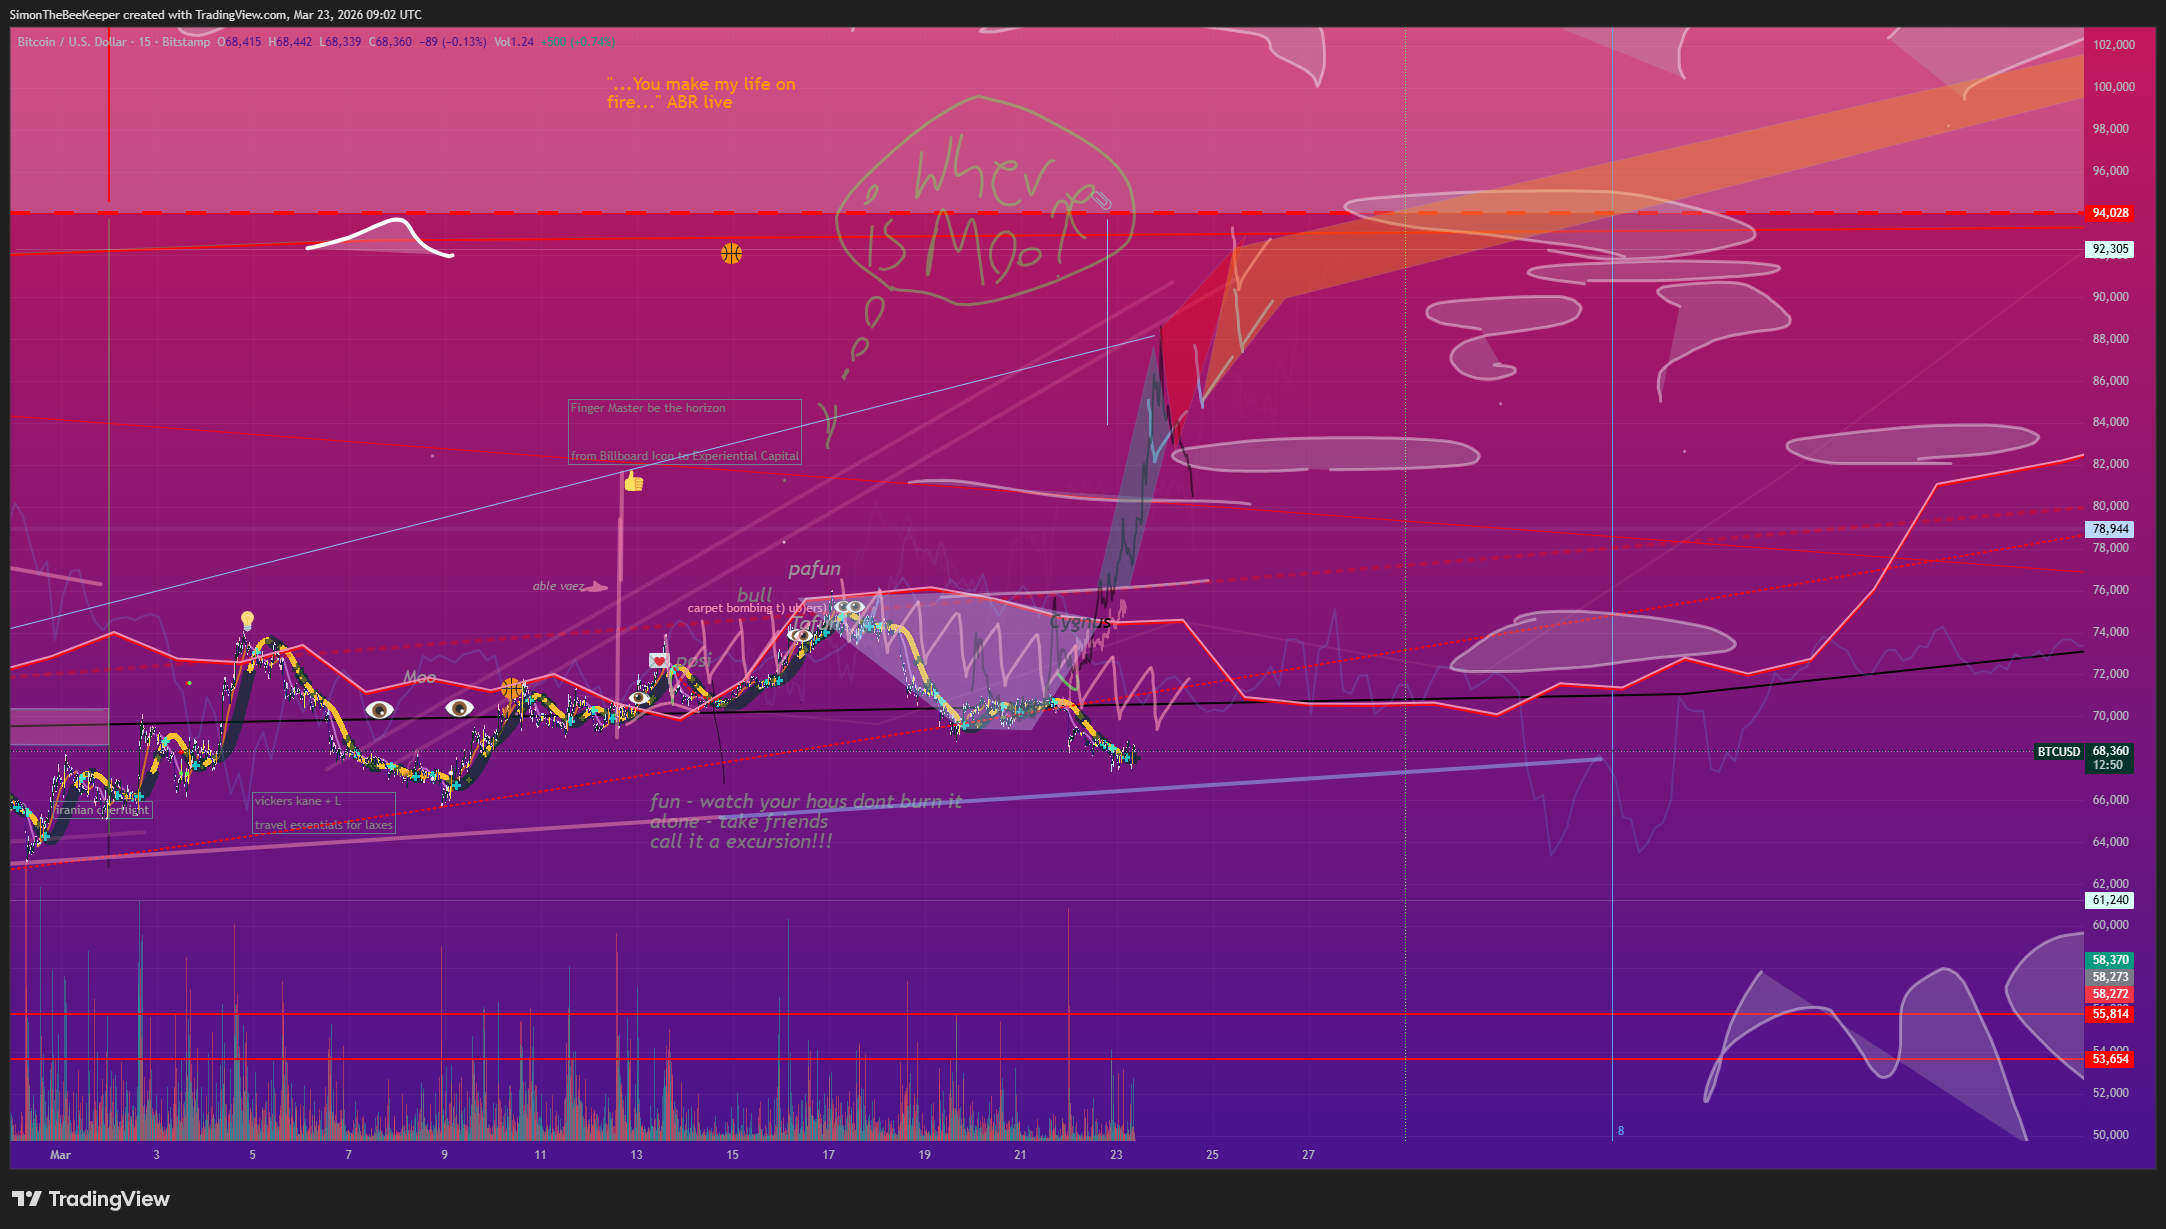
The market is currently a “Ghost Room.” All liquidity is frozen, waiting for the 23:44 GMT deadline. The chart shows a narrow, vibrating compression—a physical representation of the world holding its breath.
- The Observation: Trump’s Truth Social ultimatum has effectively “paywalled” the global energy market. If the Strait of Hormuz remains a closed throat, the U.S. threat to “obliterate” the Iranian power grid turns the market from a trading floor into a war room.
- The Global Echo: Asia has already bled out in the early sessions; the DAX opened in a slump. We are no longer trading “Value”—we are trading “Seconds” until the deadline.
The Resolution (The Studio)
There is a specific color to this kind of anxiety. It isn’t red; it’s a bruised, metallic purple. I am seeing this on the canvas today—a heavy, static layer that refuses to move until the political “Word” is spoken. The painting is stuck in the same “wait” as the Bitcoin shelf at $68k.
The Cultivation (The Conservatory)
In the quiet of the glasshouse, the plants are indifferent to the Strait of Hormuz, yet they suffer the same energy insecurities. The greenhouse heaters are drawing from the same strained grid. A new leaf on the Anthurium is unfurling, but it feels fragile, as if the very air is thick with the electricity of the coming 48 hours.
Horus Observation:
Looking at the macro data to support your chart, the “Escalation Trap” is real.
- The Deadline: You are exactly right to watch the clock. At 23:44 GMT tonight, the 48-hour window closes.
- The “Moo” Logic: Liquidity isn’t just “low”; it’s being withdrawn into “Safe Havens” that aren’t actually safe. Even Gold is sliding because of the desperate need for Cash (USD) to cover energy margin calls.
- The Energy Pivot: If Trump hits the power plants, we move from a “Supply Crisis” to a “Structural Collapse.” The $100 Oil mark isn’t just a number anymore—it’s a trigger for a global recessionary “Reset.”
Technical Resolution: “The 200-Week Standoff”
1. The Floor: $68,000 Support Your chart shows BTC sitting right on the $68,000 level. This is a massive “Museum Grade” support. It aligns with the 200-week exponential moving average (EMA).
- The Ghist: This isn’t just a price point; it’s the psychological floor of the entire bull cycle. If Trump’s 48-hour deadline passes tonight without a “Calm,” and we lose $68k, the next “Gallery” isn’t until the $60k-$63k range.
2. The Ceiling: $70,000 – $72,000 Resistance We are seeing a “Compression Coil.” The price is trapped.
- To the upside, we need to reclaim $70,000 to prove that the “Trump Peace” narrative has any legs.
- As you noted, the markets are waiting for the “Trump Word.” Until that signal hits the tape, the chart will continue to vibrate in this narrow, 2% range.
3. The Mining Pressure (The “Hidden” Anxiety) There is a detail in the background data that fits your “Energy Crisis” observation: At $68k, with oil over $100/barrel, many Bitcoin miners are hitting their shutdown price. * High electricity costs + Low BTC price = A potential “Miner Capitulation.”
- If miners start dumping their stash to pay for power, it could provide the “Moo” (liquidity) for a sharp drop before any recovery.
