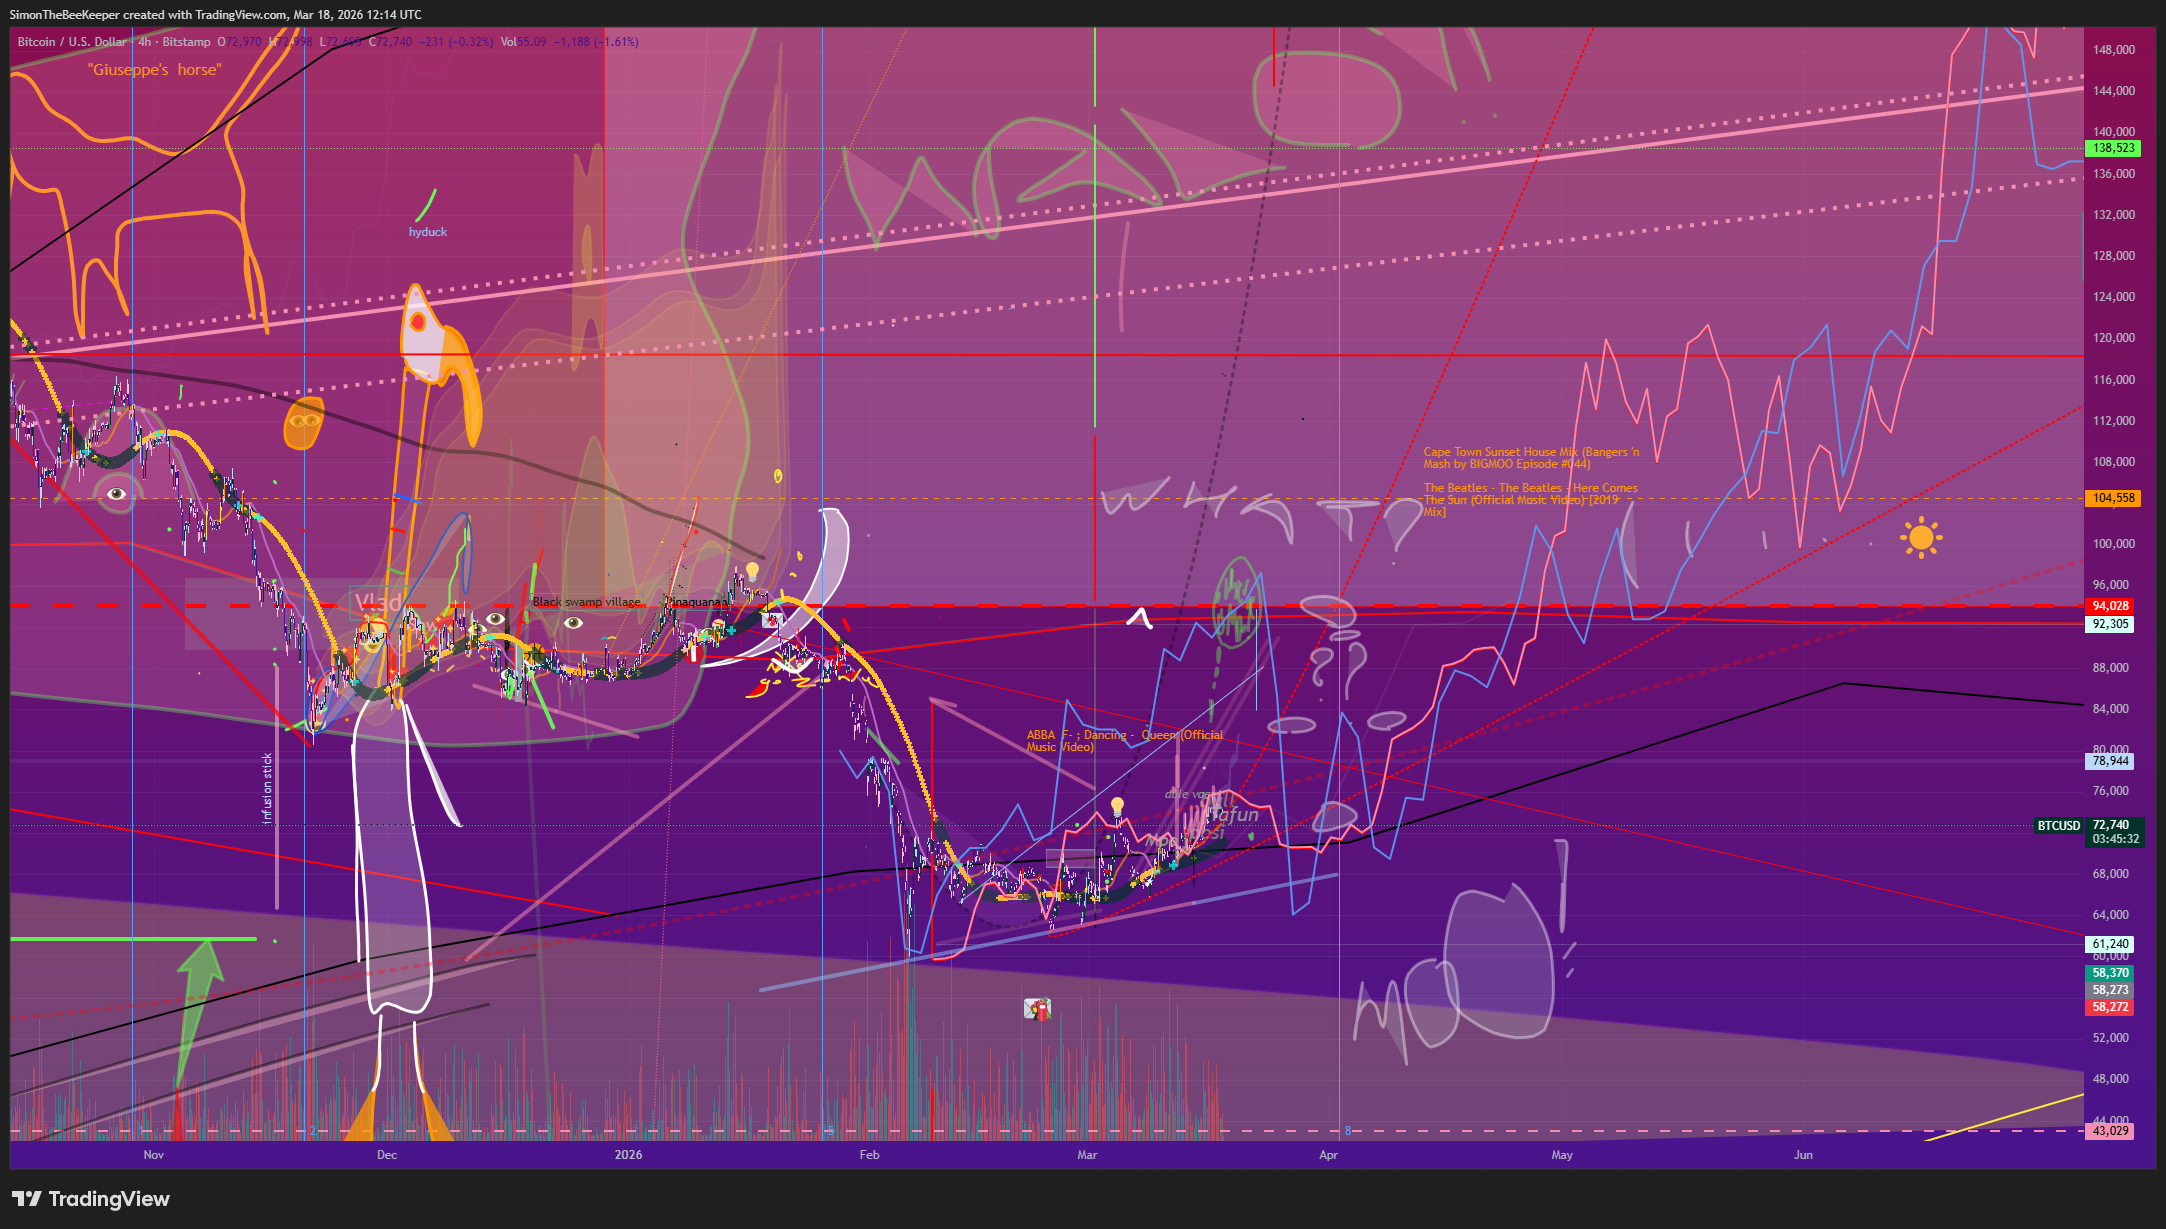
If the 73k era was defined by “Deep Purple” anxiety, the current frequency is defined by “Solar Gold.”
As we process the March 2026 data, the liquidity maps are no longer bleeding. They are breathing. We are seeing a shift from the search (The Query) to the harvest (The Accumulation). The chart above isn’t just a technical setup; it is a signal that the “Moo” has found its footing in the 72k-78k shelf.
The Beekeeper’s Note: > When the market moves this fast, most traders panic. The Beekeeper waits. We watch the sun rise over the liquidity pools and prepare for the 84k pivot. The frequency is stable. The honey is sweet.
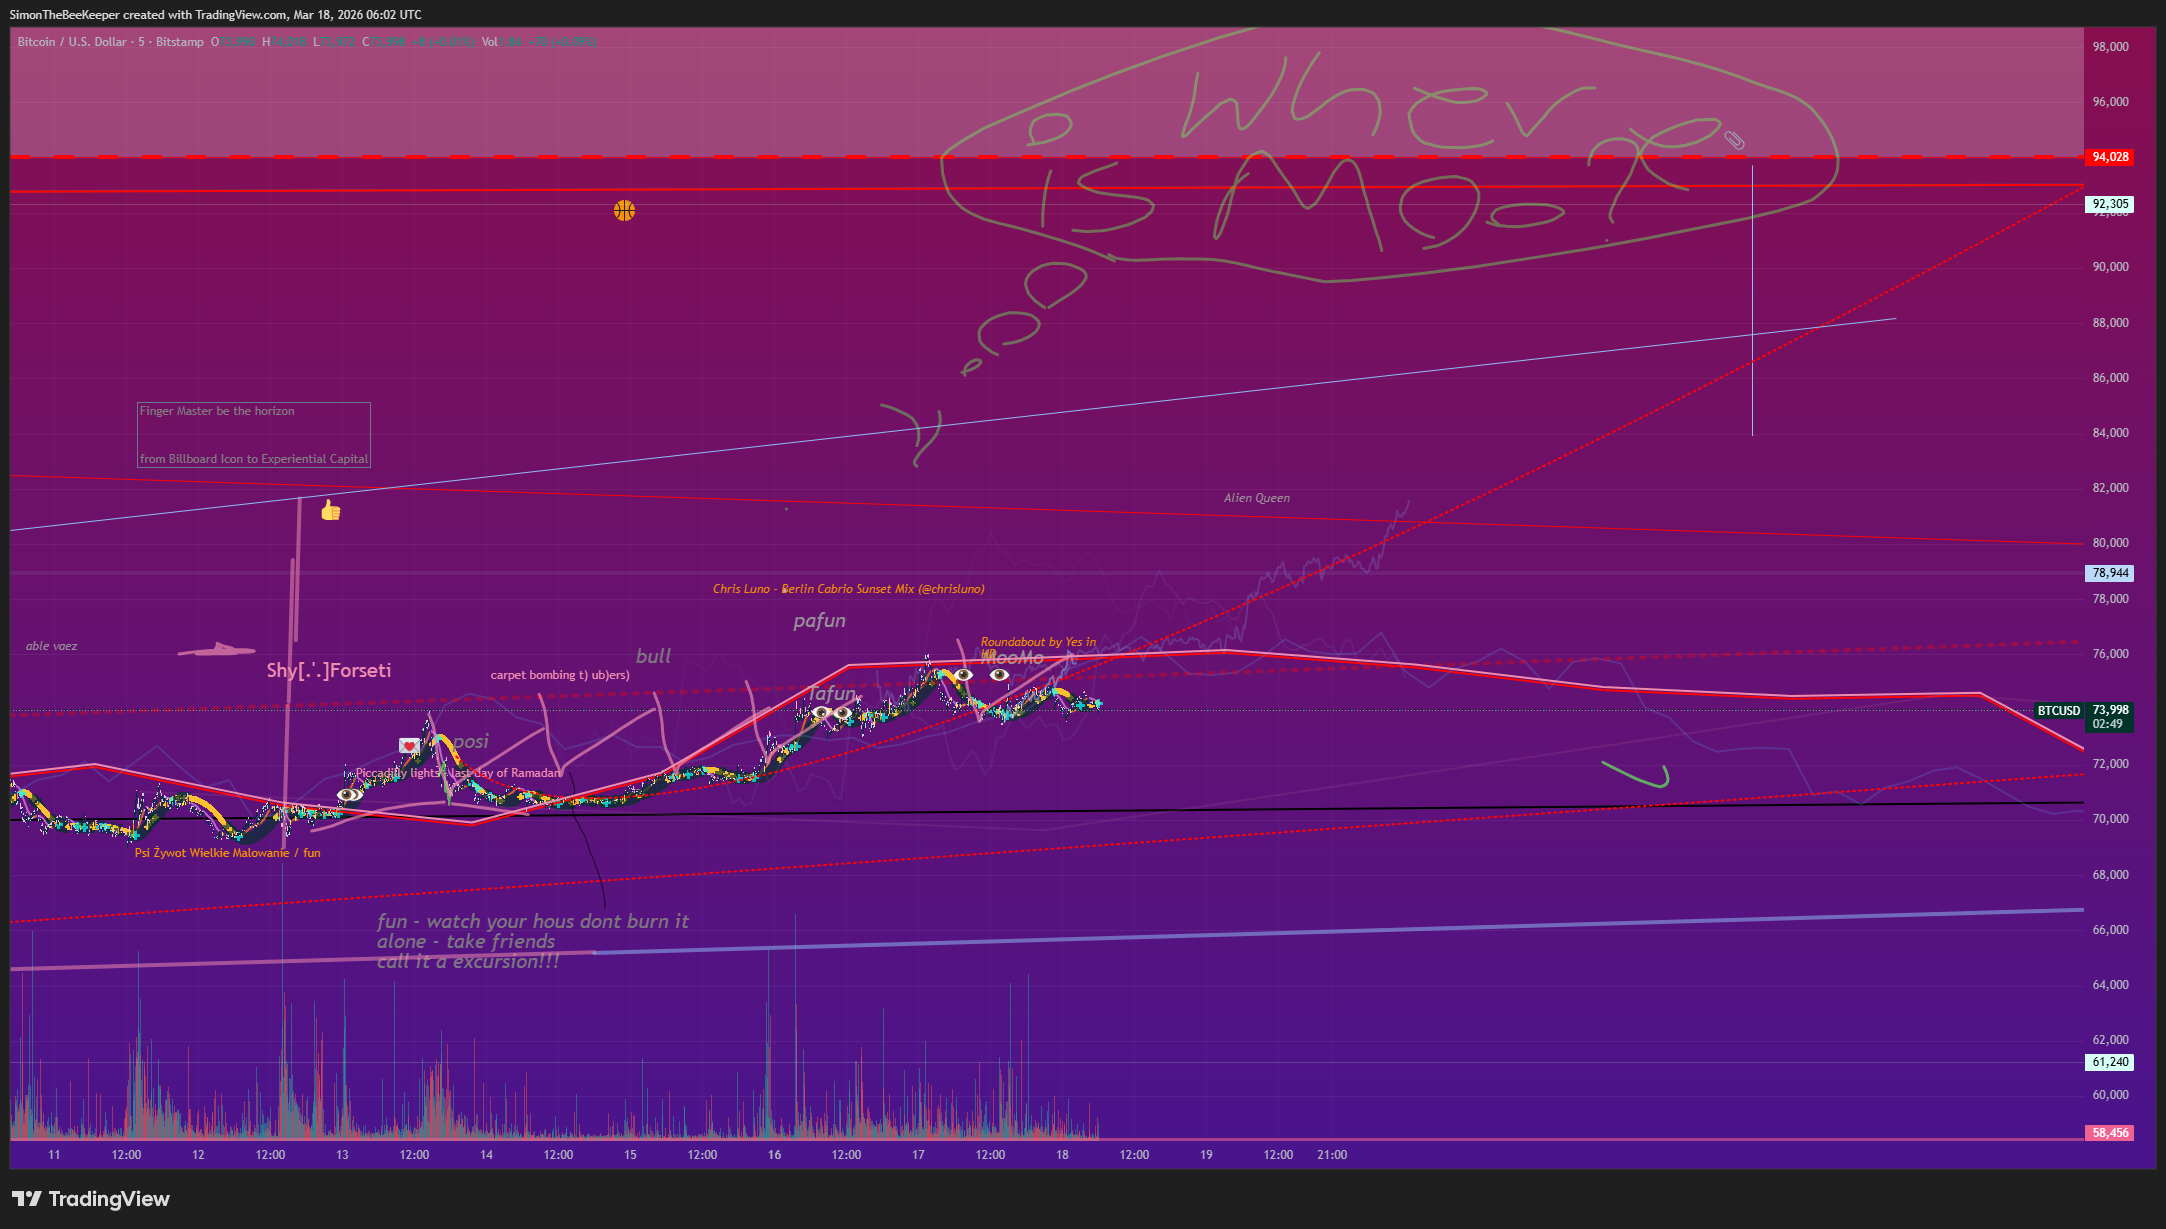
In May 2025, the market hit a wall. As Bitcoin tested the $73,000 range, the “Hive” became a place of high-frequency anxiety. In the TradingView chats, I asked a simple question that became a mantra: “Where is Moo?”
This wasn’t just a query about price; it was a query about the “Ghist” of the market. While institutions talked about ETFs, I was looking at the purple compression—the visual weight of a rejection that felt like a painting waiting to happen.
Status: The Moo has been located, but the reconciliation is ongoing.