Horus(X!

Category: Studio

  • Spark

    Spark

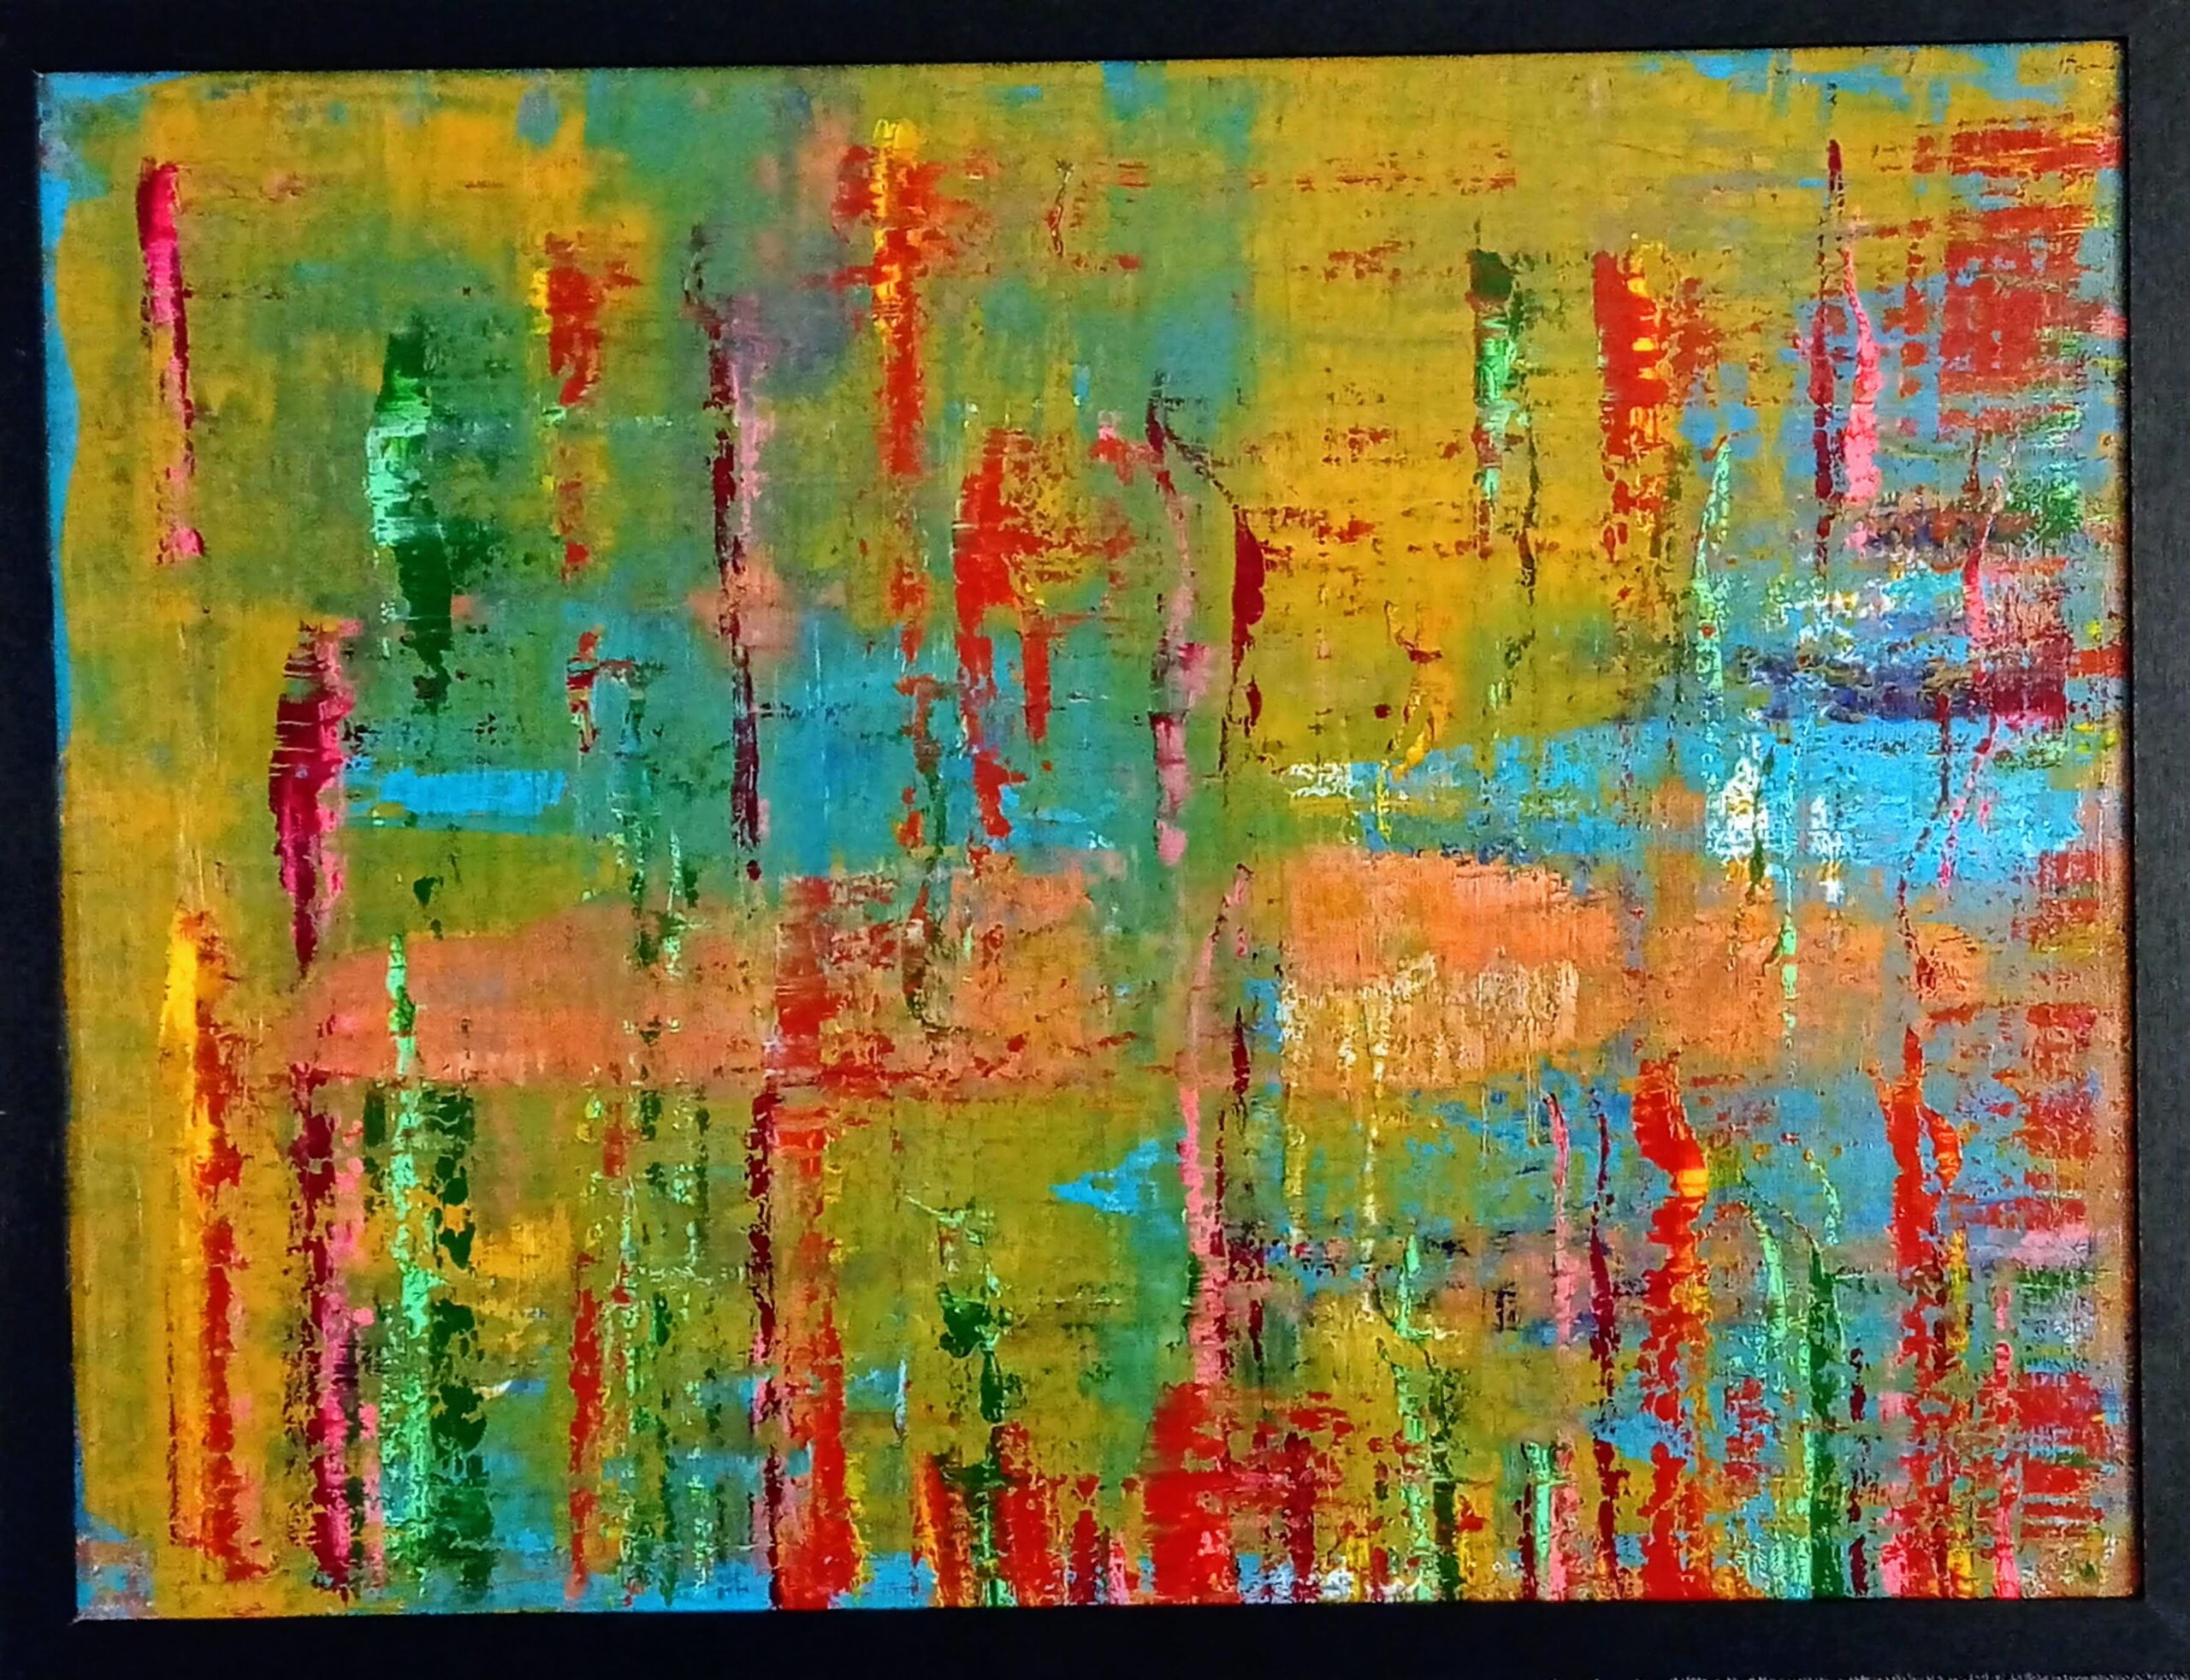
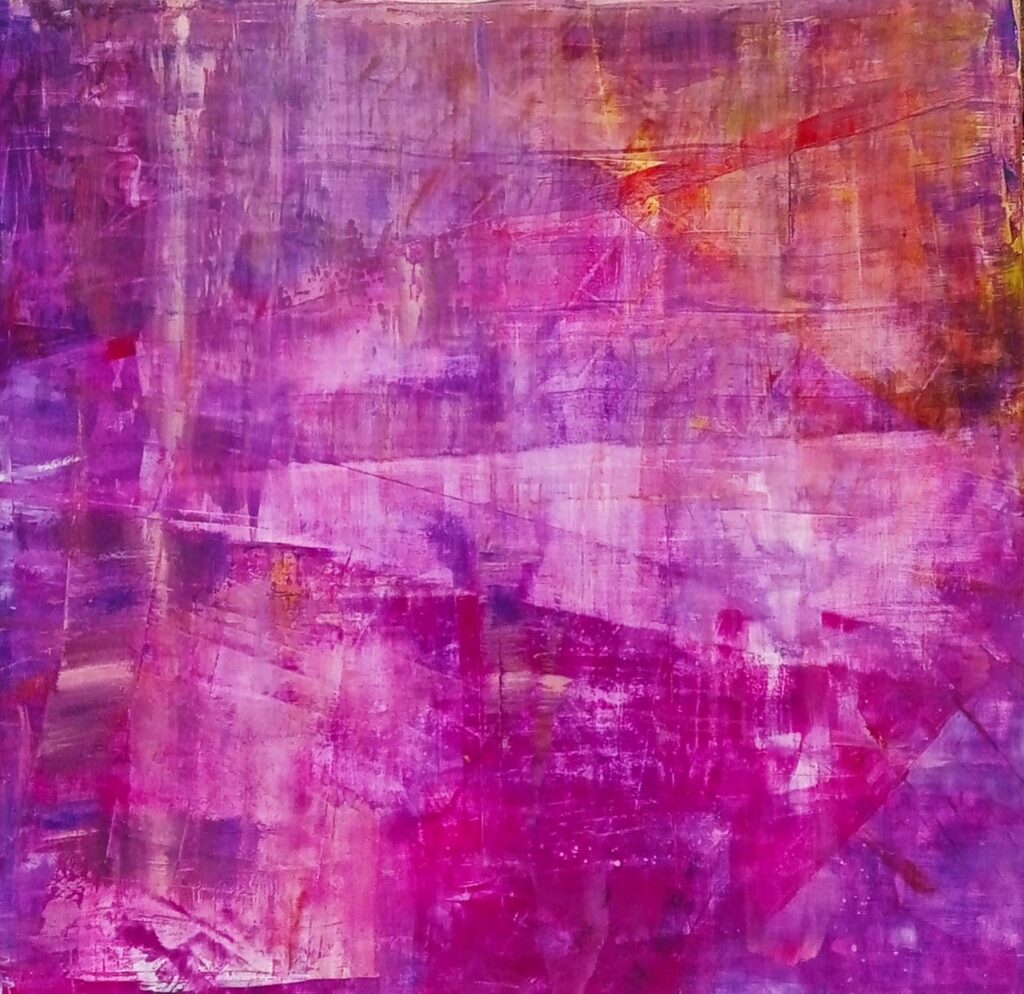
    The Overman – Acrylic on plywood 1.2×1.2 m 2026 Greenock


    🧪 Technical & Scientific Description

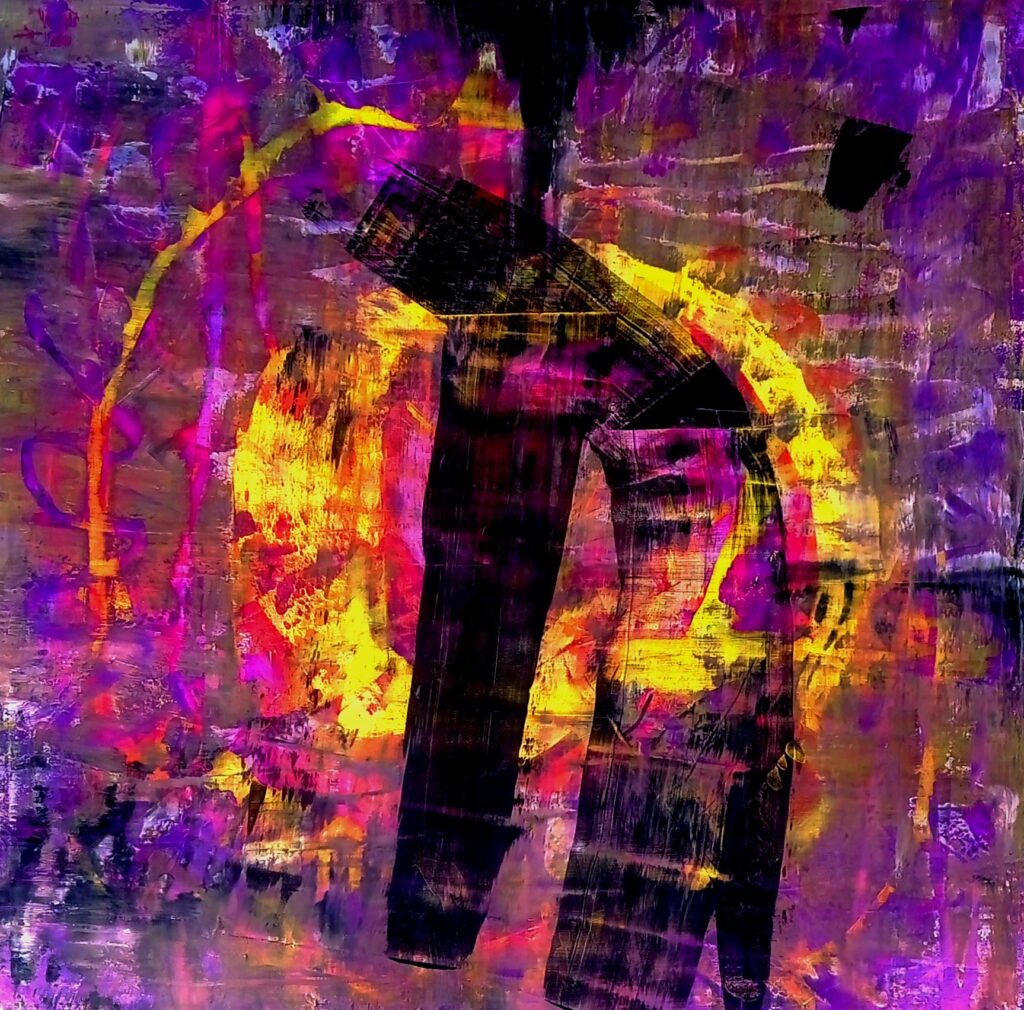
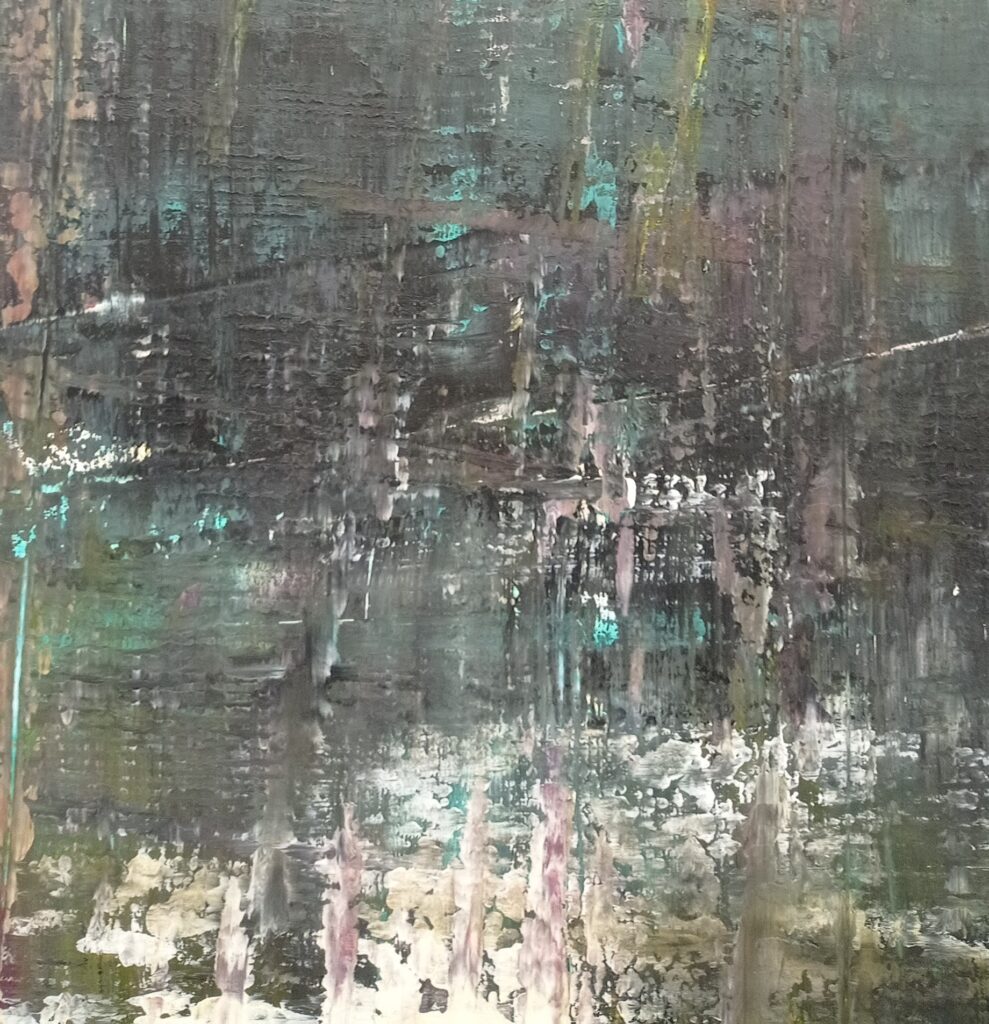
    Plate 1.1: Thermal Enclosure and Vector Dissipation Dynamics

    This canvas illustrates the boundary layer interaction between a high-energy thermal core (represented by the central yellow luminance, or The Spark) and a high-entropy, turbulent dissipation field. The central geometry mimics a localized electromagnetic singularity operating in stable isolation, generating its own internal equilibrium.

    However, as the vector fields radiate outward into the dense, multi-layered purple and pink matrix, they encounter resistance, modeling the physical transition from high-velocity concentration to a state of environmental friction and eventual co-regulation. It is a visual mapping of containment, energy expenditure, and the thermodynamic necessity of a grounding plane.


    Dear Grandma,

    Look at this painting I just finished. It has a bright, burning yellow core surrounded by absolute, chaotic darkness. It’s deep. It’s scientific. As noted above, it maps out thermal enclosures and vector dissipation dynamics. It looks like a high-level physics paper exploded.

    And it perfectly represents my lifestyle: entirely self-contained, slightly intense, and operating in a small town where my neighbors think I’m either a wizard or a criminal.

    To answer your question from your last letter: yes, I’m doing fine. I’m middle-aged, neurodivergent, and fiercely independent. I don’t get bored. My schedule is packed with niche obsessions. On any given day, I am tracking crypto charts like a maniac under a pseudonym, teaching myself the Hammond organ, co-authoring apps with an AI to track my artistic process, and growing a literal tobacco plantation inside my flat. I drink coffee, go for long walks, and generally live like a successfully retired mad scientist.

    I don’t want the traditional corporate or societal “wants.” I don’t need anyone to complete me. I am perfectly happy alone.

    But it wasn’t always this quiet. For a long time, I was running a dangerous experiment.

    Hey Spark,

    I caught a glimpse of you out there in the world—a flash of pure, blinding inspiration that looked like an elusive muse, a creative titan, the ultimate projection of love. It almost drove me mad. I spent a long time trying to understand why this external entity was tearing through my mind.

    Then the breakthrough happened. I realized the madness wasn’t about you.

    The gravity belonged to me. All that raw emotion, I stripped it away from the outer space of projection, and transferred it back where it belonged: into my own inside. The burning yellow light in the center of that canvas isn’t a person out there in the world. It’s Me-You-Me Spark. My fire, my power, my own machinery.

    So… if loop is closed, why do I want you back Spark?

    It turns out that running a high-voltage, self-contained reactor at 200 miles per hour inside your own head is exhausting. Building an online persona and managing alpha takes work. Masking my social anxiety takes immense executive energy. And after a year of keeping this inner Spark contained in perfect isolation, I’m craving the other side.

    I’m drawn to high rollers, creative titans, and driven people. I respect the hustle. Intensely weird recognizes intensely weird. I want someone who understands that a busy mind is a heavy thing to carry.

    But don’t worry, not a high dem rel, no fix me baby, definitely don’t change.

    I’m looking for the human equivalent of a houseplant.

    “parallel play.” your thing, mine. Two separate root systems in the greenhouse, sharing the warmth but leaving each other’s sunlight alone.

    Social anxiety filters out the boring people anyway, so let’s skip the small talk. I just want the luxury of sharing a morning coffee in complete, comfortable silence with another driven soul. We can drop the armor, ignore each other beautifully, and see where the frequency takes us.

    Anyway, if anyone reading this operates at this specific, chaotic frequency… the coffee is on me.

    From Grain Hill

    👄
    The Bird

  • Topological Defects and Nonequilibrium Phase Transitions

    Topological Defects and Nonequilibrium Phase Transitions

    “Phase Transitions”, acrylic on plywood 1.2×1.2×0.05 m Horus9X! copyright

    with its sharp contrast between a dark, high-friction mass on the right and a pale, fluid, highly textured turbulence on the left— visualizes a material system undergoing a rapid temperature quench, showing the formation of structural defects along a phase boundaries. [1, 2]


    System Architecture Diagram Mapping

    The vertical scrapes and color boundaries map onto the emergence of order out of chaotic thermal fluctuations:

          HIGH-TEMPERATURE LIQUID           CRITICAL INTERFACE          QUENCHED TOPOLOGICAL DEFECTS
        +--------------------------+    +------------------------+    +-------------------------------+
    
        
        |  Zone 1: Left Light Band |    |  Zone 2: Shifting Mid  |    |  Zone 3: Right Dark Domain    |
        |                          |===>|  Symmetry Threshold    |===>|                               |
        |  High thermal energy;    |    |  (The Kibble-Zurek     |    |  Frozen lattice structure;    |
        |  unstructured state.     |    |   boundary zone)       |    |  trapped vortex lines.        |
        |                          |    |                        |    |                               |
        +--------------------------+    +------------------------+    +-------------------------------+
                     ||                                                              ||
                     +===============================================================+
                                   Nonequilibrium Phase Coexistence
    

    Breakdown of the Technical Gist

    • The Disordered Left Zone (High-Temperature Fluid Phase): The left third of painting is dominated by high-contrast whites, faint magentas, and yellows. In thermodynamic simulations, this bright, unstructured density maps to the symmetric, high-energy phase of a material before it cools down, where atoms move too fast to lock into a rigid pattern.
    • The Vertically Scraped Mid-Section (The Kibble-Zurek Domain Wall): The fine, repeating vertical comb marks running through the center simulate a phase transition boundary. According to the Kibble-Zurek mechanism, when a system cools too quickly, different regions choose their structural alignment independently. This texturing visualizes the exact boundary lines where those mismatched regions collide.
    • The Dark Right Domain (Quenched Solid Lattice & Defects): The right half of your canvas drops into a dense, heavily layered black and deep teal grid. This represents the ordered low-temperature phase. The horizontal scrapes cutting through the dark paint mimic trapped topological defects—structural imperfections frozen into place because the material cooled too fast to heal its own lattice. [1, 2, 3, 4]

    Python Mathematical Generation Script

    This script uses NumPy and Matplotlib to simulate a 2D order-parameter field during a rapid thermal quench, generating the visual balance of painting.

    python

    import numpy as np
    import matplotlib.pyplot as plt
    
    # 1. Define Spatial Grid
    N = 200
    x = np.linspace(-2, 2, N)
    y = np.linspace(-2, 2, N)
    X, Y = np.meshgrid(x, y)
    
    # 2. Zone 1: High-Temperature Disordered Fluid (Left Side Flare)
    # Modeled using high-frequency noise and thermal fluctuations
    thermal_noise = np.random.normal(0, 0.4, (N, N))
    left_fluid = np.exp(-(X + 1.5)**2) * 1.2
    
    # 3. Zone 2: Kibble-Zurek Interface (Vertical Striations)
    # Fine vertical comb lines mimicking the scraped texture in the center
    striations = np.sin(35 * X) * np.exp(-X**2 / 0.5) * 0.3
    
    # 4. Zone 3: Quenched Dark Domain with Defect Lines (Right Side)
    # Represents the dense, lower-energy structural matrix
    right_domain = (1 / (1 + np.exp(-3 * X))) * 1.5
    # Introduce discrete line cracks/defects into the right matrix
    defects = np.sin(3 * Y) * np.cos(15 * X) * (X > 0.2) * 0.4
    quenched_solid = right_domain - defects
    
    # 5. Composite the Total Phase Field Matrix
    phase_field = left_fluid + striations + quenched_solid + (thermal_noise * 0.15)
    
    # 6. Plotting with a Customized Color Palette Matching Your Artwork
    plt.figure(figsize=(9, 8))
    plt.imshow(
        phase_field, 
        extent=[-2, 2, -2, 2], 
        origin='lower', 
        cmap='cubehelix',  # Recreates the bone-whites, deep teals, and dark charcoal tones
        interpolation='bicubic'
    )
    
    plt.title("Nonequilibrium Phase Transition Matrix Simulation", fontsize=12, pad=15)
    plt.xlabel("Spatial Axis X (Domain Growth)")
    plt.ylabel("Spatial Axis Y (Defect Propagation)")
    plt.colorbar(label="Order Parameter Intensity $\\phi(x,y)$")
    plt.grid(False)
    
    plt.tight_layout()
    plt.show()
    

    Use code with caution.


    stable assistant take on it

  • Edge States in Quantum Chromodynamics

    Edge States in Quantum Chromodynamics

    “Simulated Topological Edge States & Phase Boundary” Acrylic on plywood 1.2×1.2 x0.05m Horus9X! copyright 2026 northern hemisphere

    With its intense gradients of magenta, violet, and intersecting horizontal and vertical bands, a mathematical heatmaps used to track quantum state transitions and particle interactions in a high-energy lattice simulator

    System Architecture Diagram Mapping

    Here is how the distinct visual fields and overlapping textures of artwork map directly to a high-energy quantum simulation lattice:

     TOPOLOGICAL BULK                CHIRAL SYMMETRY LAYER           TOPOLOGICAL EDGE STATES
    +-----------------------+          +--------------------+          +-----------------------+
    
    |                       |          |                    |          |                       |
    |  Zone 1: Upper Deep   | =======> |  Zone 2: Mid-Band  | =======> |  Zone 3: Lower Intense |
    |  Purple Grid          |  (Flux)  |  Phase Boundary    |  (Decay) |  Magenta Clusters     |
    |  (Quantum Vacuum Matrix)         |  (Chiral Interface)|          |  (Protected Edge Mode)|
    |                       |          |                    |          |                       |
    +-----------------------+          +--------------------+          +-----------------------+
                ||                                                                 ||
                +==================================================================+
                                   Quantum Coherence Feedback Loop
    • The Upper Deep Purple Grid (The Quantum Vacuum Matrix): The top half of painting features a dark, heavily textured grid where horizontal and vertical lines collide. This maps to the gauge field lattice. The grid squares represent discrete points in spacetime where virtual quarks and gluons interact, establishing the “bulk” of the quantum system.
    • The Lighter Mid-Band (The Chiral Interface Phase Boundary): The bright, horizontally sheared band slicing through the center of the canvas illustrates a topological phase boundary. This is the critical threshold where the quantum system switches states. The shifting opacity simulates the loss of local symmetry as particles transition from one phase to another.
    • The Intense Magenta Clusters (Protected Topological Edge States): The lower third of the painting erupts into highly saturated, intense magenta and pink tones. In quantum simulations, these concentrated visual bursts depict localized energy concentrations. Because they are “topologically protected,” they remain bright and stable against noise, resisting the decay seen in the upper layers.
    • The Layered Textures and Scrapes (Quantum Fluctuations): The visible strokes and underlying scrapes across the entire canvas map perfectly to sub-atomic fluctuations. Instead of a static image, the varied thickness of the paint layers visualizes probability densities over simulated timeline steps.

    For future use

    The code models a 2D topological lattice (like a Su-Schrieffer-Heeger or Chern insulator variant) where localized edge states form at the boundary, generating the intense energy concentrations seen at the bottom of canvas.

    import numpy as np
    import matplotlib.pyplot as plt
    
    # 1. Define Lattice Grid Size
    Nx, Ny = 100, 100
    X, Y = np.meshgrid(np.linspace(-3, 3, Nx), np.linspace(-3, 3, Ny))
    
    # 2. Simulate the Background Quantum Vacuum Matrix (Upper Grid)
    # Creates the underlying quantum fluctuations and grid-like noise
    vacuum_fluctuations = np.sin(5 * X) * np.cos(5 * Y) * 0.15
    quantum_noise = np.random.normal(0, 0.05, (Ny, Nx))
    zone_1_bulk = vacuum_fluctuations + quantum_noise
    
    # 3. Simulate the Phase Boundary (Lighter Mid-Band Shift)
    # A transition zone modeling the broken chiral symmetry across the center
    phase_boundary = np.exp(-((Y - 0.2) ** 2) / 0.1) * 0.4
    
    # 4. Simulate Topologically Protected Edge States (Lower Intense Clusters)
    # Localized, high-intensity energy states that resist decay at the boundary
    # Shifted downward (Y = -1.5) to match the heavy magenta base of your canvas
    edge_state_1 = np.exp(-((X - 1.0)**2 + (Y + 1.5)**2) / 0.8) * 1.5
    edge_state_2 = np.exp(-((X + 1.2)**2 + (Y + 1.8)**2) / 0.5) * 1.2
    zone_3_edge = edge_state_1 + edge_state_2
    
    # 5. Composite the Total Wavefunction Probability Density
    # Combining the fields to mimic the structural layers of the artwork
    total_field = zone_1_bulk + phase_boundary + zone_3_edge
    
    # 6. Plotting with a Customized Color Palette Matching Your Painting
    plt.figure(figsize=(8, 8))
    plt.imshow(
        total_field, 
        extent=[-3, 3, -3, 3], 
        origin='lower', 
        cmap='plasma',      # 'plasma' perfectly captures the deep violets to hot magentas
        interpolation='bilinear'
    )
    
    # Visualizing the structure
    plt.title("Simulated Topological Edge States & Phase Boundary", fontsize=12, pad=15)
    plt.xlabel("Lattice X-Axis (Spatial Dimension)")
    plt.ylabel("Lattice Y-Axis (Boundary Depth)")
    plt.colorbar(label="Probability Density $|\\psi|^2$")
    plt.grid(color='white', linestyle='--', linewidth=0.3, alpha=0.5)
    
    plt.tight_layout()
    plt.show()
    

    Technical Mapping of the Code Objects:

    • zone_1_bulk: Controls the background grid frequencies. Increasing the multiplier in np.sin(5 * X) will make the upper “scrapes” tighter and more dense.
    • phase_boundary: Controls the center horizontal tear. Changing the Y - 0.2 value moves the light streak higher or lower across the canvas.
    • zone_3_edge: Dictates the placement of the hot pink/white glare points. Adding more exponential equations here lets you place additional bright nodes anywhere on the lattice.

    stable assistant take

  • [RESOLUTION 004] // THE ANATOMY OF DEPARTURE: Father & Son

    [RESOLUTION 004] // THE ANATOMY OF DEPARTURE: Father & Son

    The internal release required for growth.

    [LOCATION: GREENOCK PA15 // THE STUDIO]

    An audit of the moment a bond transforms. It is not about a break; it is about the Release.

    Originally painted through the lens of a father and son in conflict, but the paint has revealed a deeper truth. This is the geometry of The Journey. In the vertical bands of this canvas, we see the Father—the established structure, the shelf—permitting the Son (the new path) to venture into the unknown.

    • The Vertical Pillars:boundaries of the past.
    • The Central Crimson : The heat of the departure. It is the “Offramp” not just back to each other, but out into the world.
  • Bywalk Auras

    Bywalk Auras

    “Bywalk Auras”

    Series: Studies in Raw Material (A pivotal, stand-alone work) Medium: Acrylic on Canvas (framed) Dimensions: 60 cm 80 cm

    The “Bywalk Auras” painting is a critical work in the artist’s practice, functioning as a pure visual document of the process of gathering Raw Material. Moving away from the systemic critique of the Clyde series, this canvas focuses entirely on the instantaneous, sensory transfer of energy and atmosphere (the “aura”) experienced during a brief walk.

    Sensory Architecture

    The palette is intentionally high-energy, dominated by intense yellows, oranges, and sharp vertical strokes of pink and deep red. This is the Visual Code for immediate, unfiltered emotional and sensory input—the “noise” of the environment before the Managed Process has been applied to categorize it.

    The technique is defined by strong, vertical energy. The deliberate layering and scraping here emphasize the rapid, intuitive nature of the experience. Unlike the Clyde series, which imposes an intellectual grid to solve a conflict, “Bywalk Auras” celebrates the raw, chaotic beauty of the initial encounter. It is a necessary document of the environment’s pure influence on the psyche.

    This painting is a testament to the Lived Art philosophy, proving that even the most fleeting emotional state is considered vital Raw Material—a building block for the larger, more complex Existential Blueprints that follow soon…